FEATURE OVERVIEW
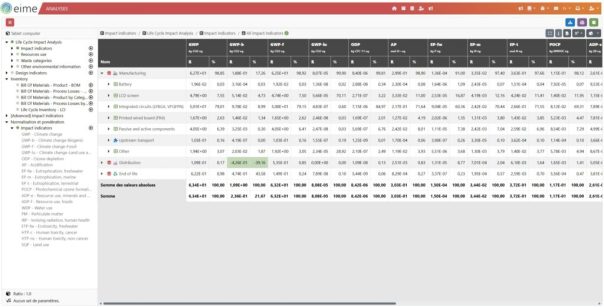
Results tables
- Change your indicator set at any time
- Display the product tree in the results table
- Add/remove indicators from the results table to highlight the indicators you want to study
- Change the presentation of results: raw values and/or percentage values; scientific notation (e.g., 6.27E+01) or decimal (e.g., 62.7)
- Download the results table in Excel format
🆕Normalization and Weighting
New features in 2025
- Normalize and weight your case study results using two formats:
- Normalization (only), or
- Normalization and weighting
- Quickly identify priority indicators:
- EIME ranks indicators in descending order of impact
- EIME highlights indicators contributing to more than 80% of the impacts (in red)
Contribution analysis
- Dynamic charts:
- Double-click on an item to access the n-1 level of the tree
- Hide unwanted items
- Highlight an item for easier reading
- Change chart colors
- Download charts in .png format


 SFR/Vodafone – Affichage environnemental
 Conforama – Affichage environnemental
 Alstom Transport – Déclarations Environnementales Produit (DEP)
 Schneider Electric – Product Environmental Profile (PEP)
 Atlantic – Product Environmental Profile (PEP)
 Arbor – Fiche Déclarations Environnementale et Sanitaire (FDES)
 Neolife – Fiche Déclarations Environnementale et Sanitaire (FDES)
 Atlantic – Communication Environnementale pour le grand public


